The CLT
- Suppose that you lived in a town with a population whose weights had a mean of 180lbs and a standard deviation of 9lbs. Now, some people in this town underwent a weight reduction program, and you want to know if it had a significant effect. Did the "intervention" work?

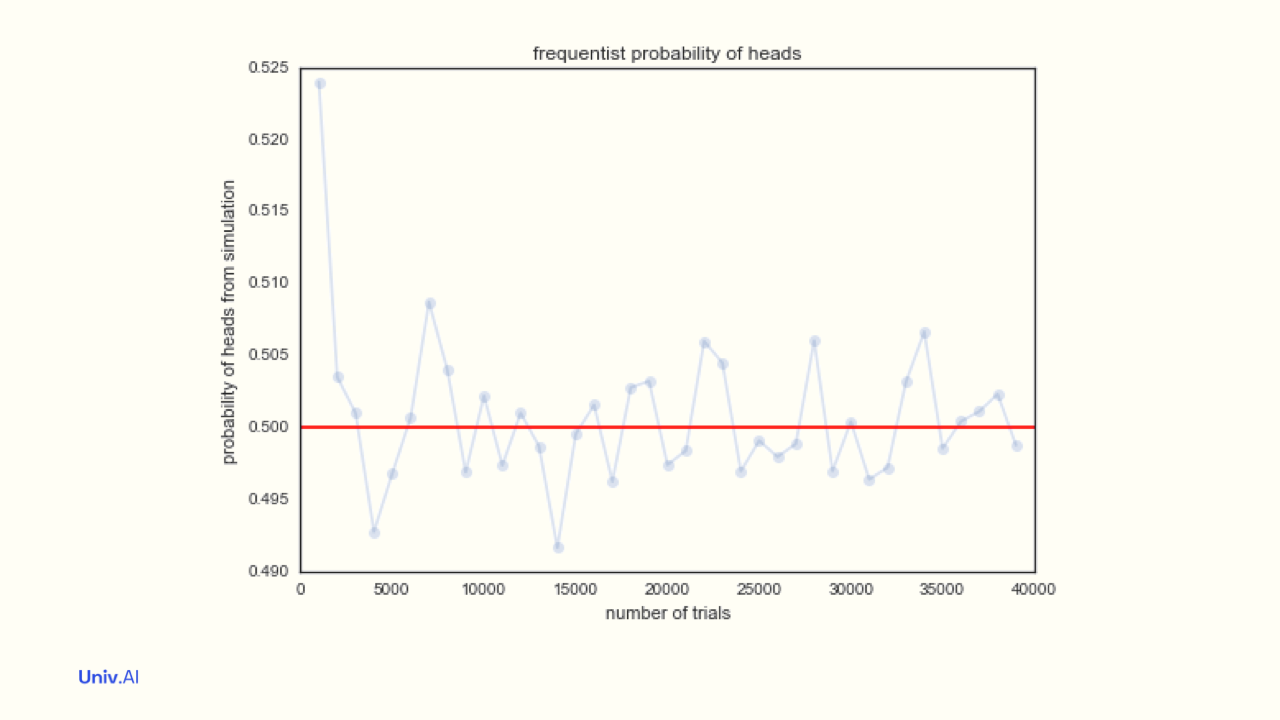
- You should ask: what is the size of the sample that underwent the intervention? To understand why, let us go back to the tosses of a fair coin that we talked about here: https://twitter.com/rahuldave/status/1425883481821704192.
-
There, we increased the size of the sample of coins being tossed, and the fraction of heads, or the average of heads(1) and tails(0) got closer to 0.5 as the size N increased. We'd asked how fast does this fraction converge to 0.5?
-
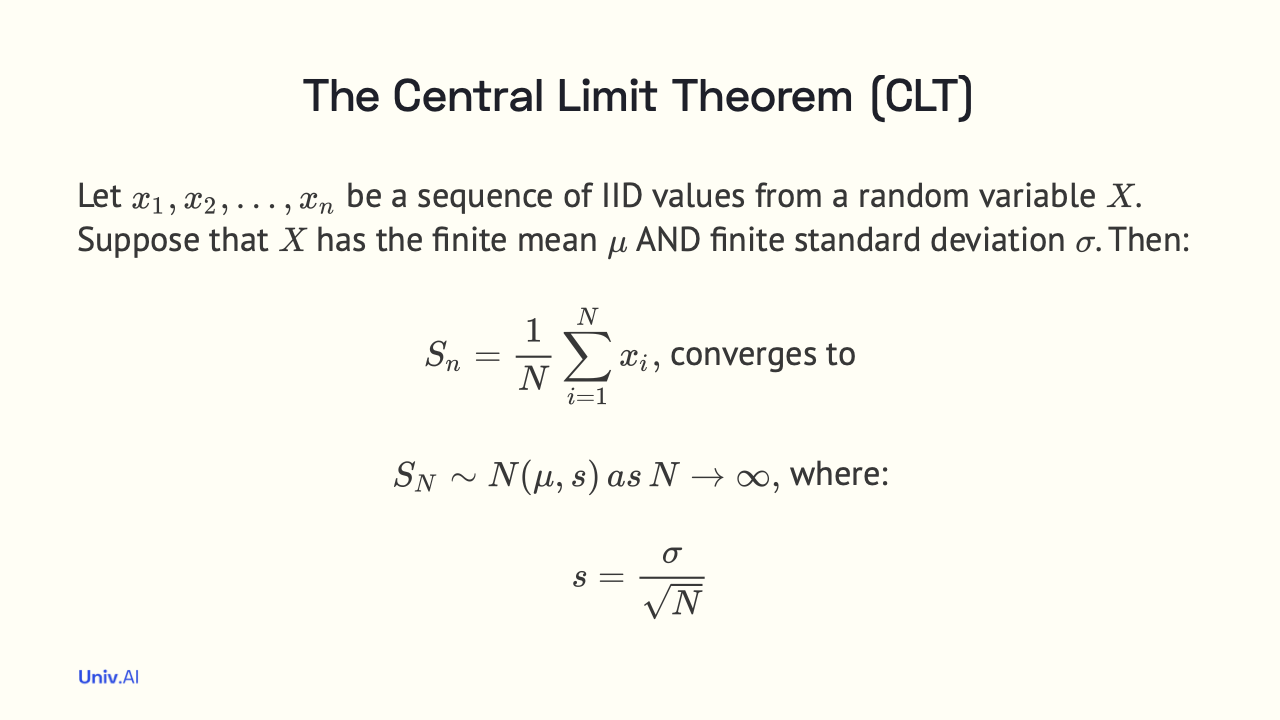
This question is answered by the Central Limit Theorem(CLT), which, it turns out, can also be used to answer the question about the significance of the intervention! The CLT starts by recognizing that different samples of the same size N will have slightly different means.
-
The CLT says that these "sample means" follow a Normal Distribution whose standard deviation decreases with increasing N. This standard deviation of sample means is called the standard error, and it is smaller than the underlying standard deviation σ of coin tosses.
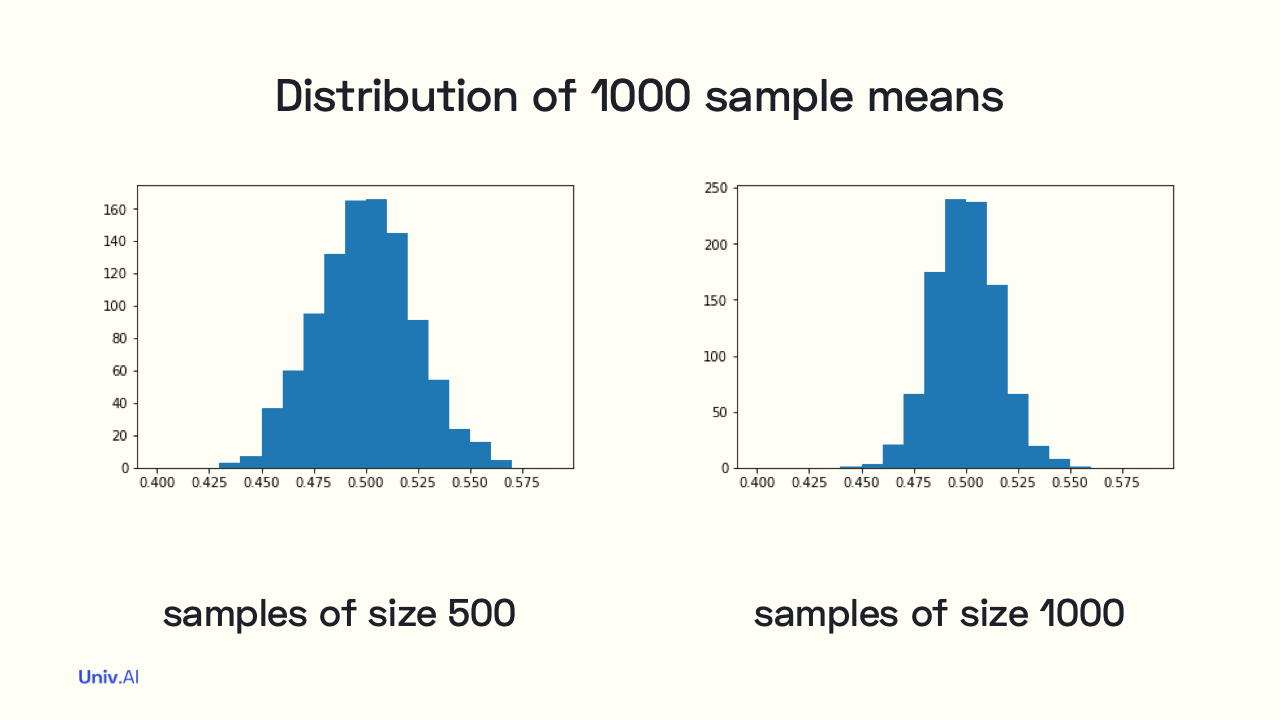
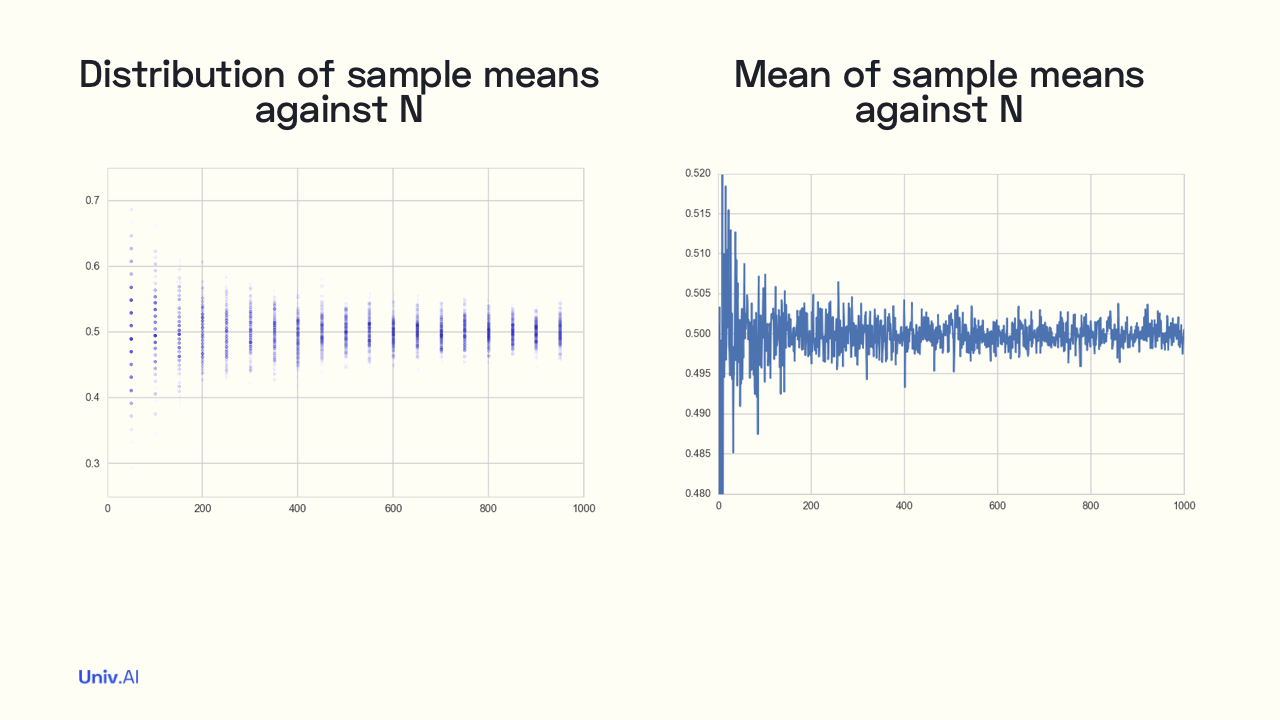
- For example, if I take 1000 samples of size 500 each, the 1000 means of 500 coin tosses each distribute themselves according to the figure on the left. If I increase the size to 1000 tosses in a sample, we get the tighter distribution on the right.
-
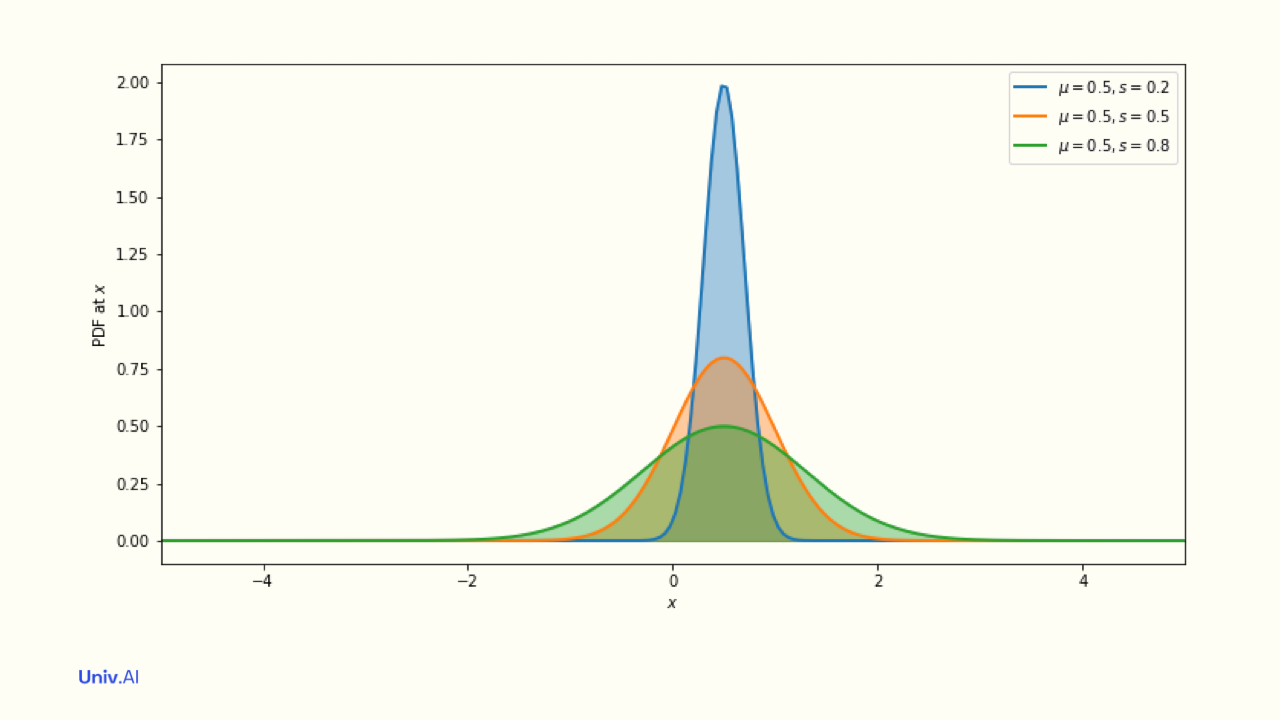
I talked about distributions in a previous thread: https://twitter.com/rahuldave/status/1428458696481247233. That thread describes the terms we use when we talk about distributions. Here, we are talking about the Gaussian or the Normal Distribution, which occurs everywhere in nature.
-
The Normal distribution N(µ, s) is symmetric about its mean µ, and 95% of the area of the distribution is between µ - 2s and µ + 2s. Lower s means smaller width; and the distribution becomes taller to compensate (keep the area at 1).
- As we increase the sample size N, the distributions of sample means tighten (left image). You can see more blue dots closer in to the 0.5 value as N increases to 1000. We plot the mean µ of these sample means in the figure on the right. µ gets closer to 0.5 too.
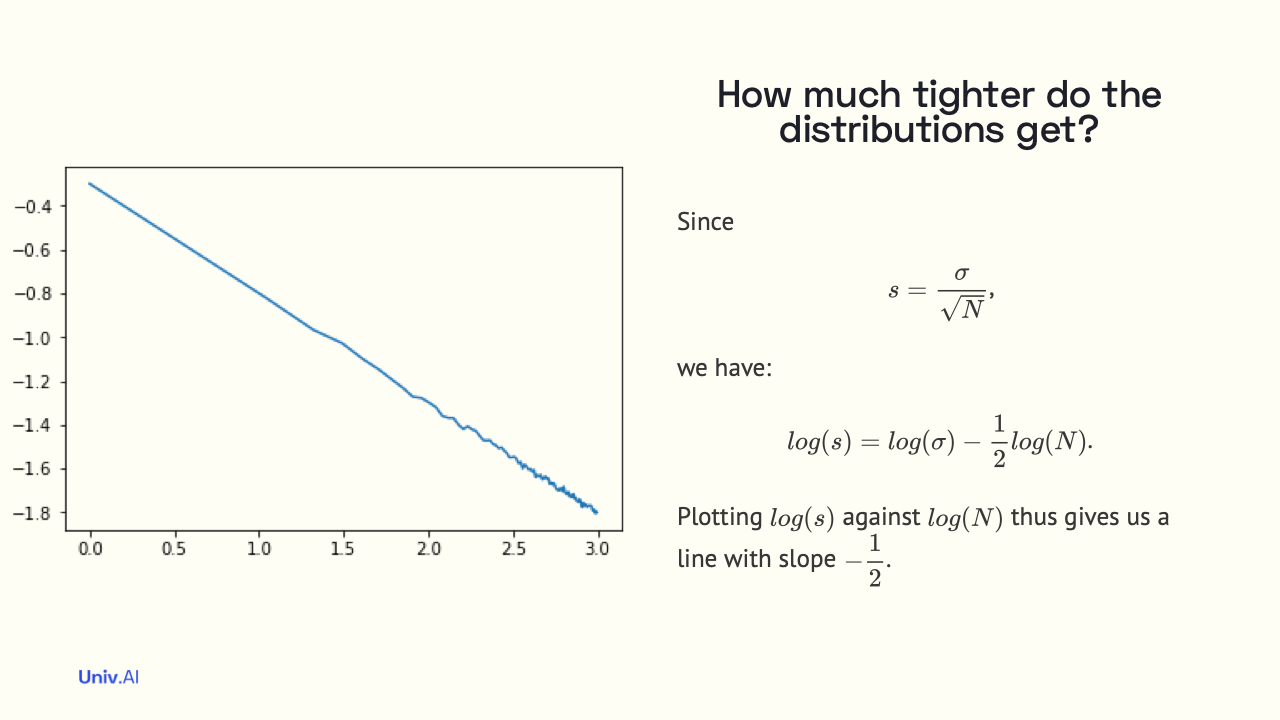
- Now let us compute the standard error (standard deviation of sample means from µ), at any N. The CLT tells us that this width s decreases with N as 1/√N. We can now use this formula to answer the question about the weight reduction intervention.
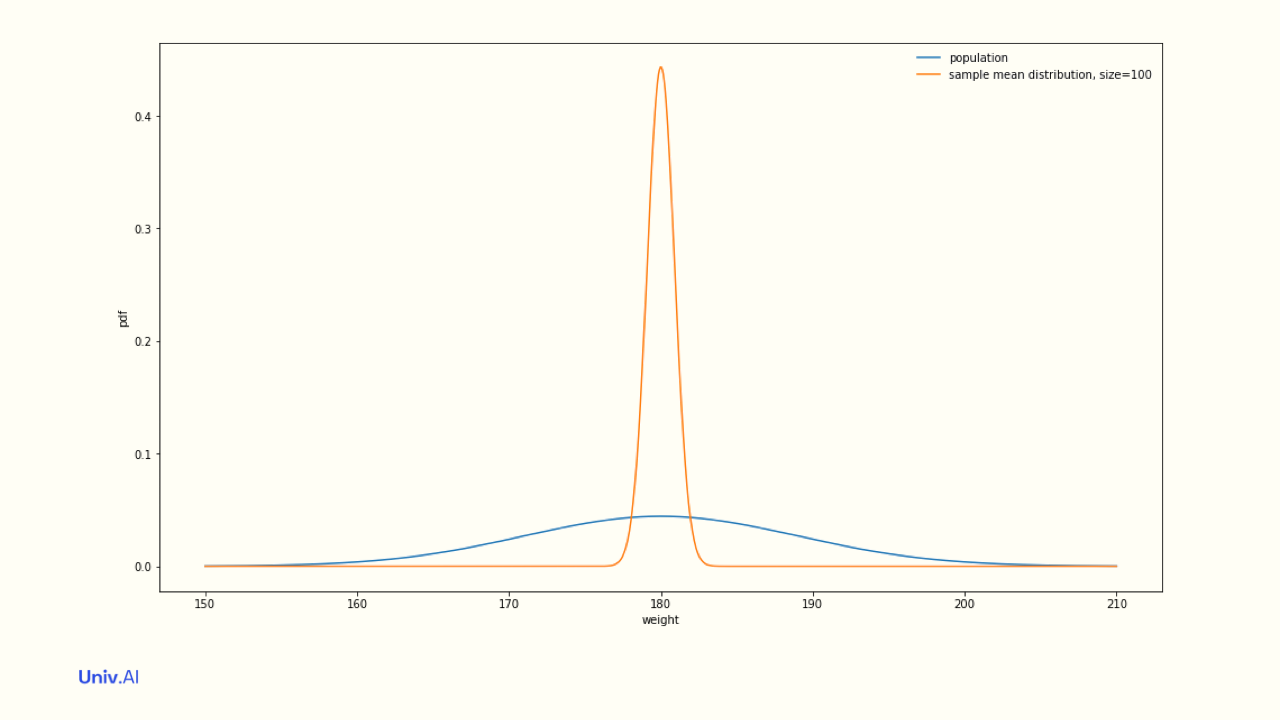
- The population's weights have a mean of 180 and a standard deviation of 9. Say you have a sample of 100 people in your intervention program. Any set of samples of size 100 would have a mean of sample means of 180 and a standard error of = 9/√100 = 9/10 = 0.9. Tight!
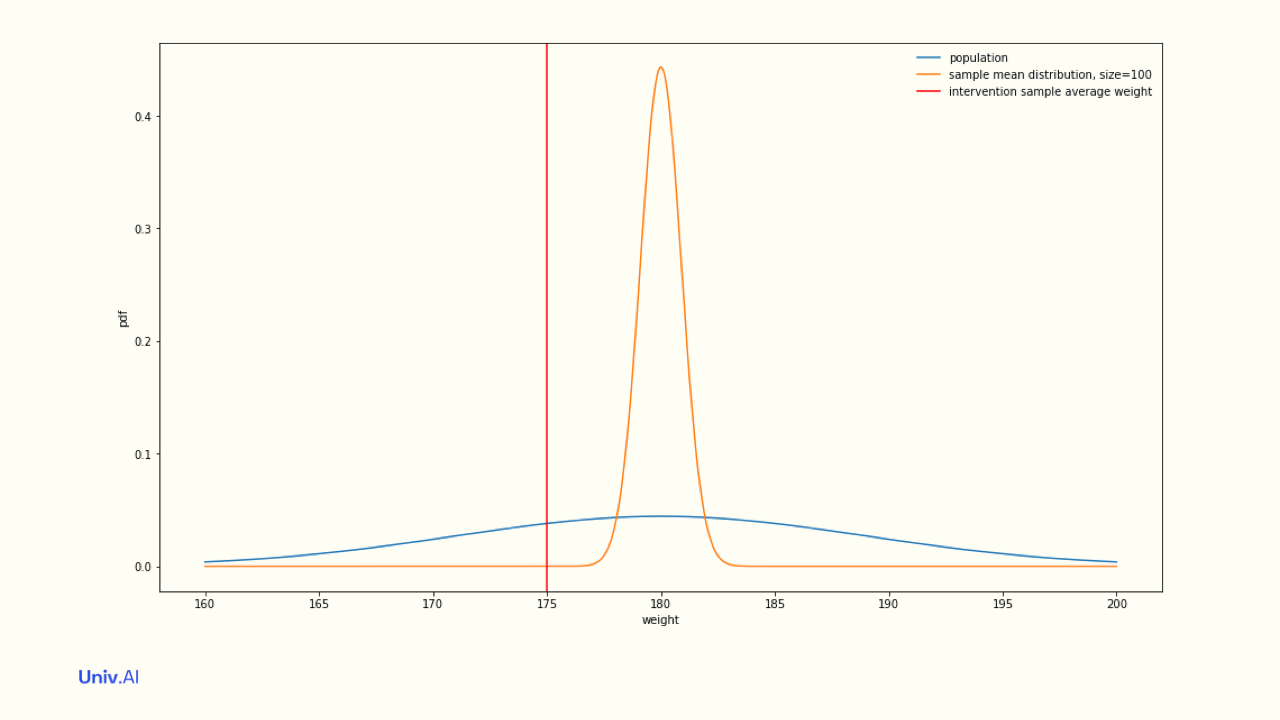
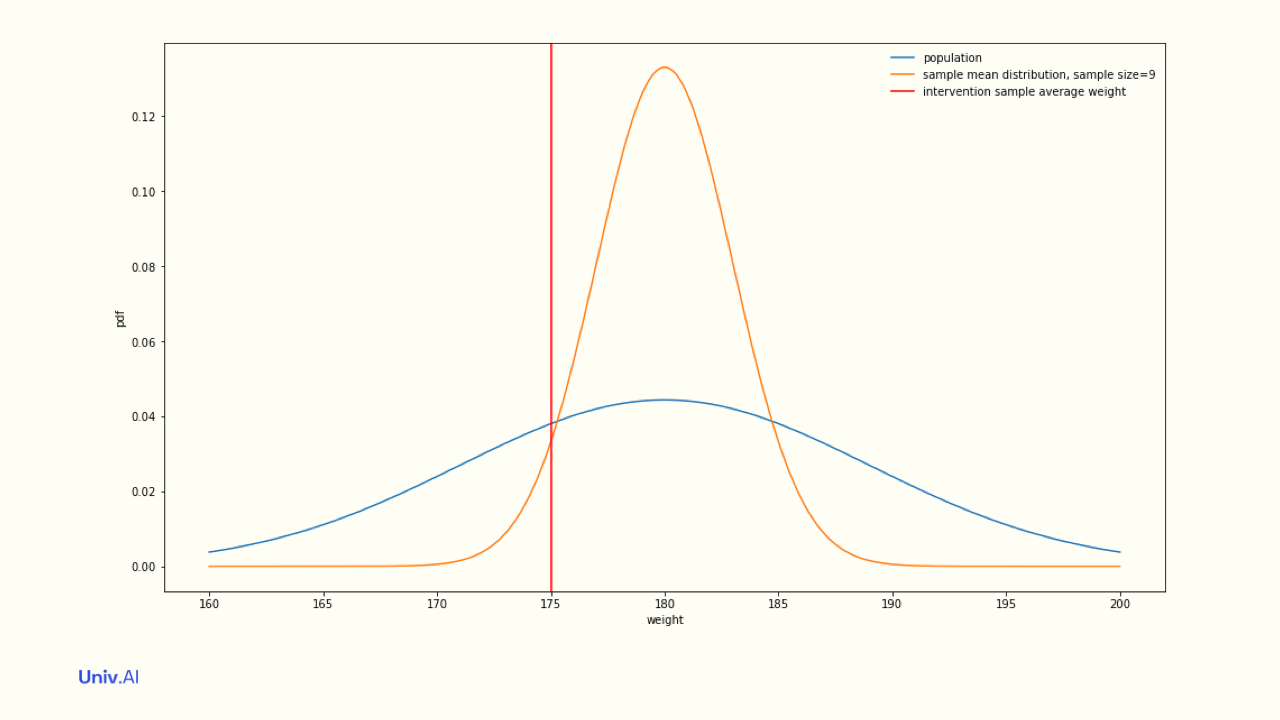
- Now, if your intervention sample of size 100 had a mean weight of 175, that number is 5 standard errors from the population mean, and thus very unlikely to have come from a sample drawn from the population. What if you had chosen a sample of 9 people instead?
- Then s = 9/√9 = 9/3 = 3. Now, if your intervention sample of size 9 had a mean weight of 175, this is less than 2 standard errors out from the population mean, and you cannot claim with a sample size of 9 that your intervention actually had a significant effect.
-
Thus the CLT hints at the size needed to see significant effects! We'll talk this and more fun stuff, like estimating Pi and its error with the LLN and CLT in future threads. Follow me on twitter at @rahuldave and keep an eye on https://stories.univ.ai for more threads!
-
You can access a permalink to this thread here: https://stories.univ.ai/centrallimittheorem/. If you enjoy tweet threads like these and like to learn Data Science and AI, check out the courses we teach at https://stories.univ.ai/aboutunivai/ or read this thread: LINK.