Keeping Visualizations Simple with Matplotlib
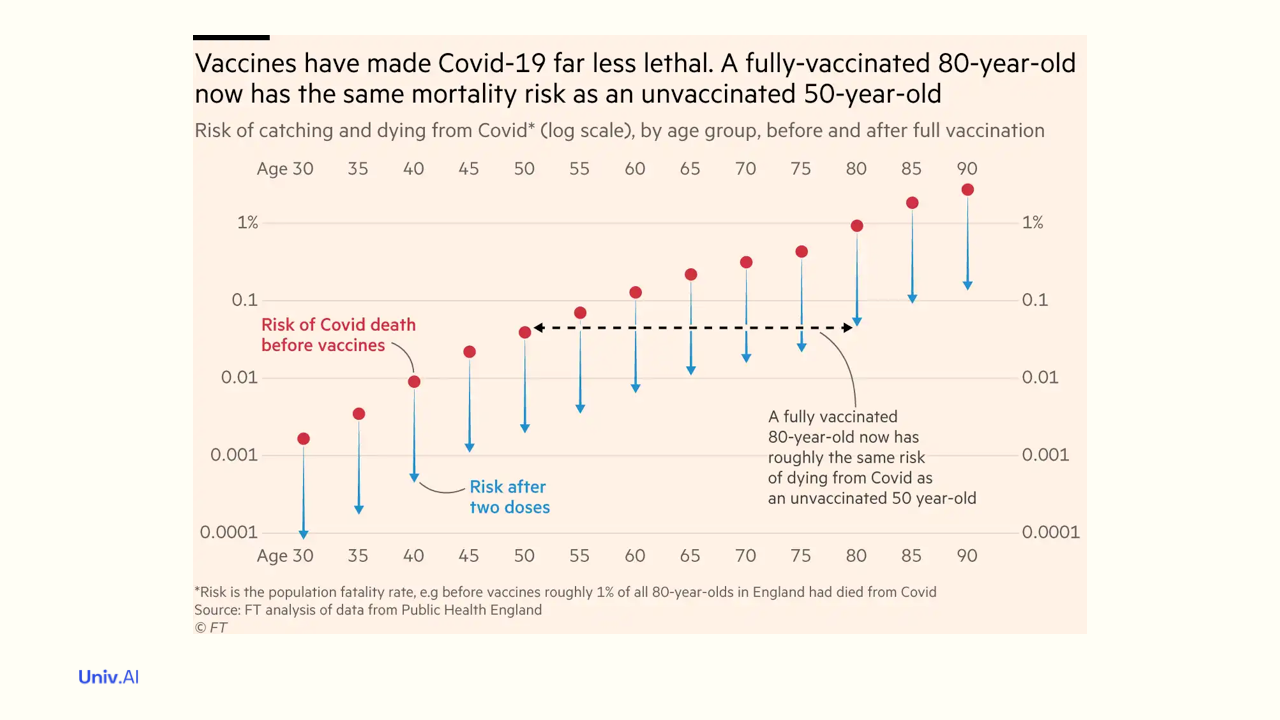
- In the thread https://twitter.com/rahuldave/status/1425200284301725708, I talked about the visualization in this image (from the financial times https://www.ft.com/content/0f11b219-0f1b-420e-8188-6651d1e749ff?hcb=1). How might we produce such visualizations?
-
We'll tackle that question in another thread, but first we must learn how to make good plots using matplotlib. Which begs the question: what is a good visualization, and how can we make it?
-
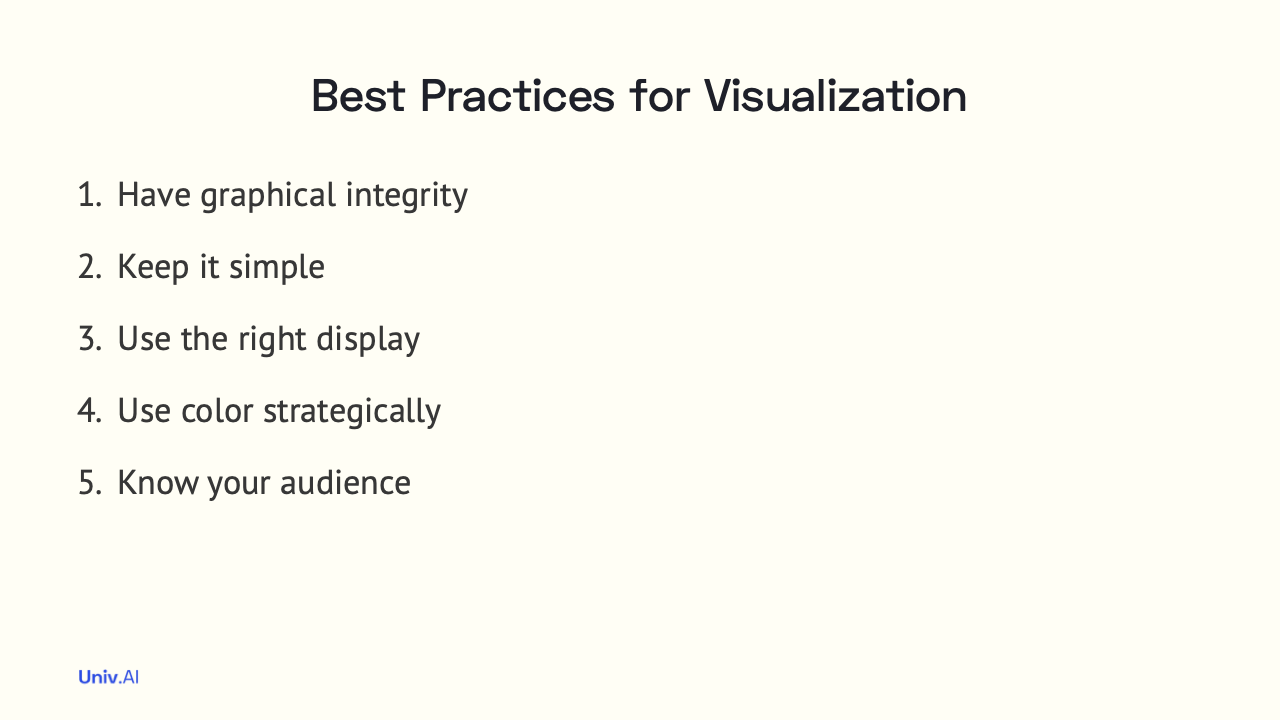
Here are some of the best practices for visualization. We'll talk about the second one today: Keep it simple!. As Antoine de Saint-Exupéry said: Perfection is achieved, not when there is nothing more to add, but when there is nothing left to take away.
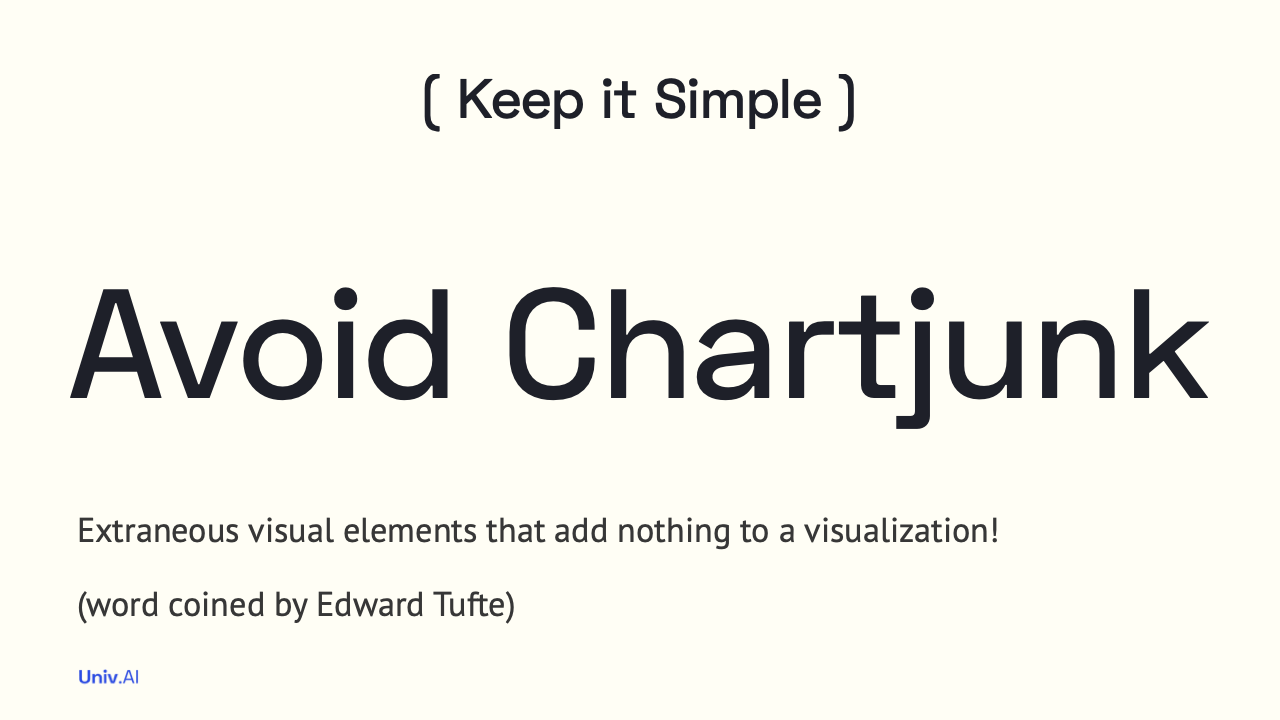
- As @EdwardTufte has persuasively argued in his books, extraneous visual elements that distract from the message should be removed. For example: tick-marks, frames, sometimes even numbers! Lets us implement this process using matplotlib for a simple example...
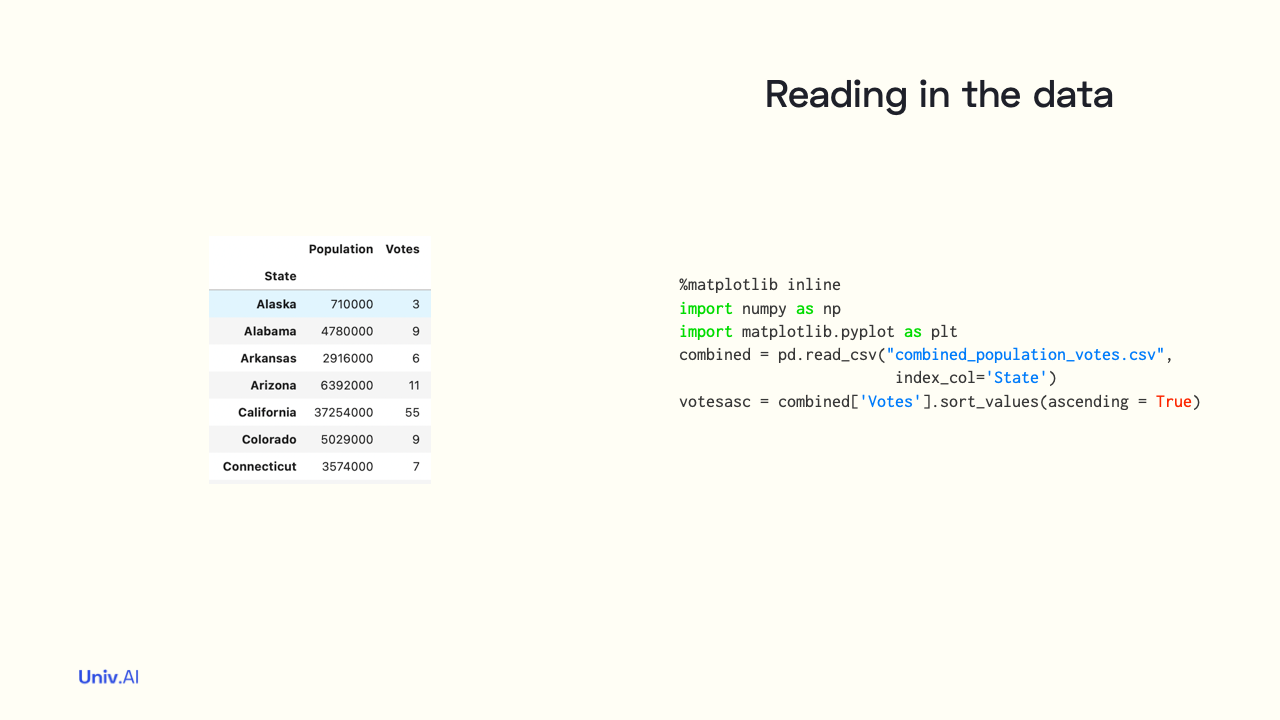
- Here is a dataset on electoral votes and population in all the US states. We'll make a bar chart comparing the electoral votes of different states. You can find the data and the analysis notebook for this thread https://gist.github.com/rahuldave/2256465a8524453cb2a4630d336f82f7.
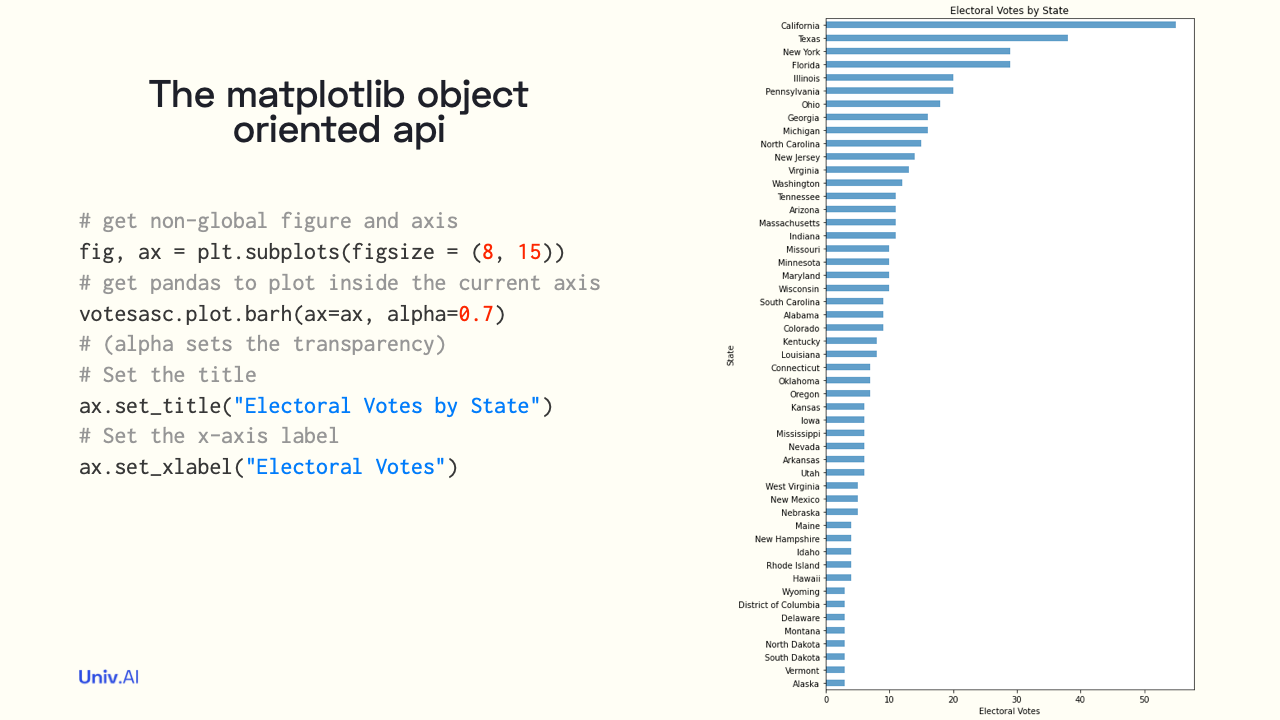
- This first snippet illustrates Matplotlib's object-oriented API. We first create a figure object, and in the context of that object, an axes object. Then pandas is used to place a bar plot into those axes. What's not goodabout this plot?
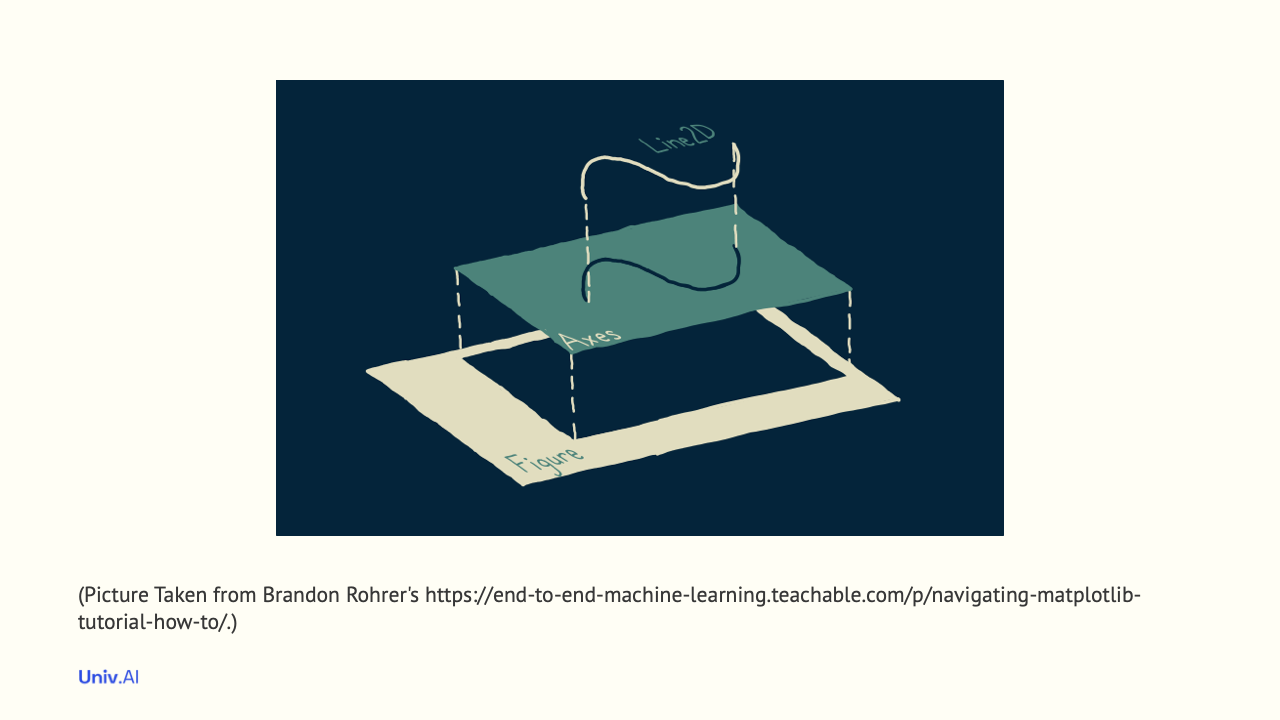
- In this picture taken from https://end-to-end-machine-learning.teachable.com/p/navigating-matplotlib-tutorial-how-to/ by @brohrer, we see that (possibly multiple) Axes sit inside a Figure, and everything else (such as xaxis, yaxis, lines, patches, text, annotations) sits inside the Axes.
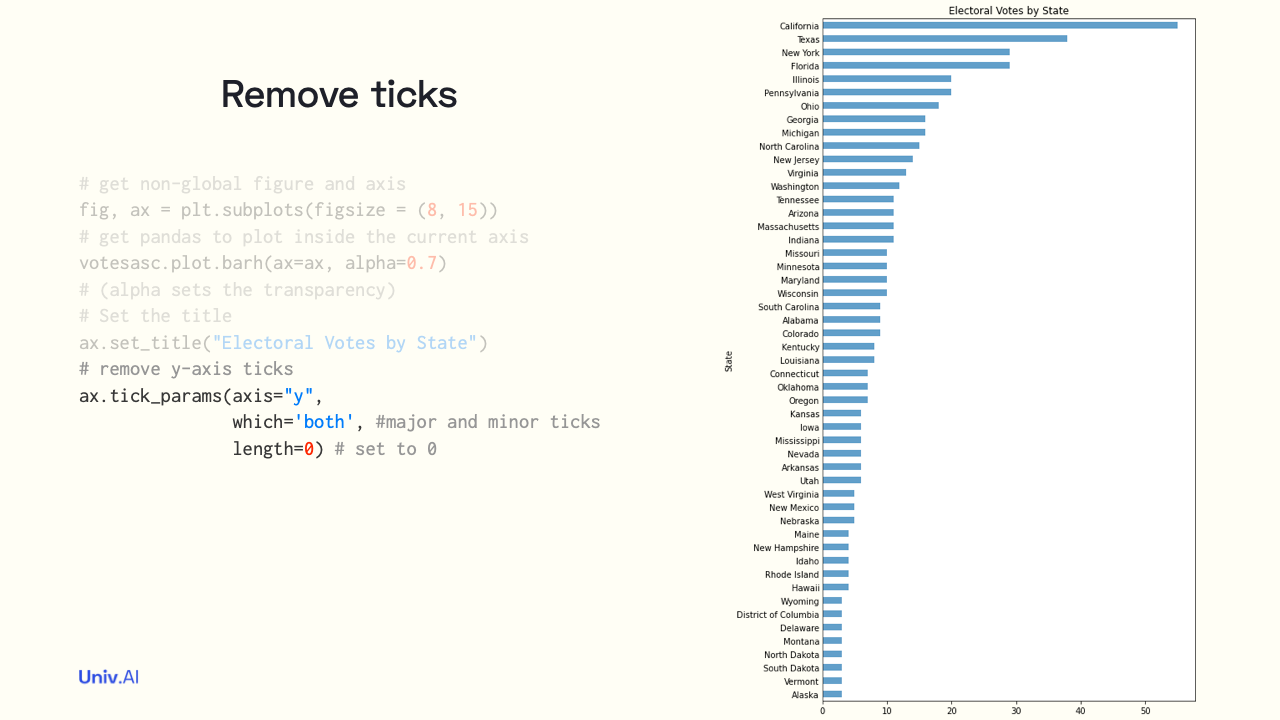
- How can we improve our plot? Do we really need y-axis tick marks with state names labeling them? How about we remove these tick-marks? We do this in matplotlib by setting their length to 0. Note that we are not removing the ticks, but just the marks corresponding to them.
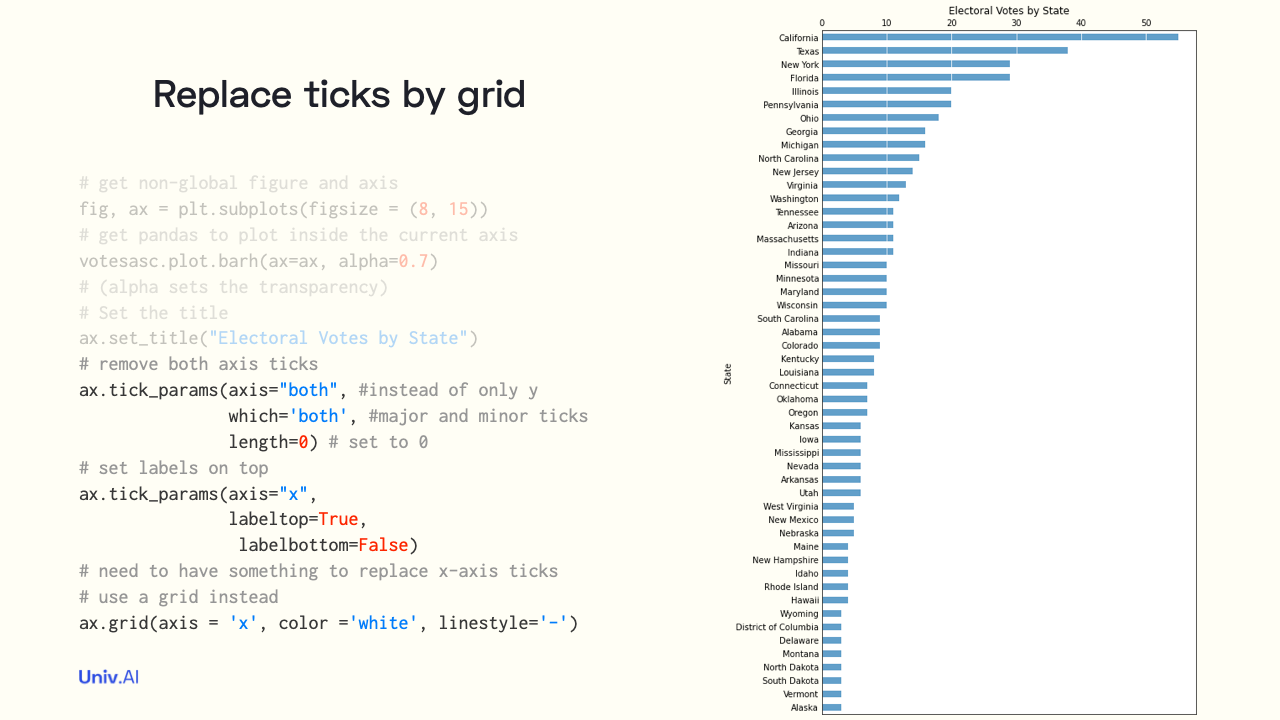
- Do we really need tick-marks on the x-axis? Why not just write the labels? And move these labels to the top where they are needed more, since the longest bars are there. Finally using a grid at the ticks helps us see the values on each and every bar!
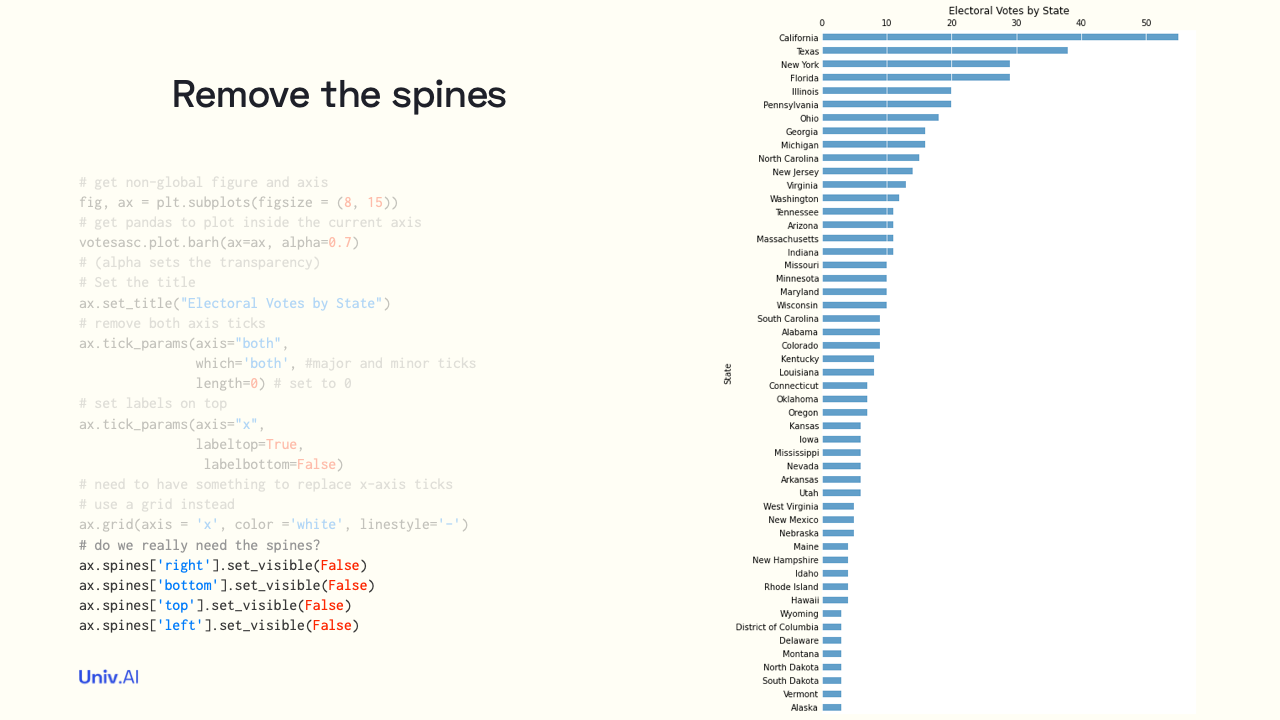
- Do the spines add anything to our presentation? No! The elements of the figure are strong enough to stand by themselves. Ok, so lets remove the spines...
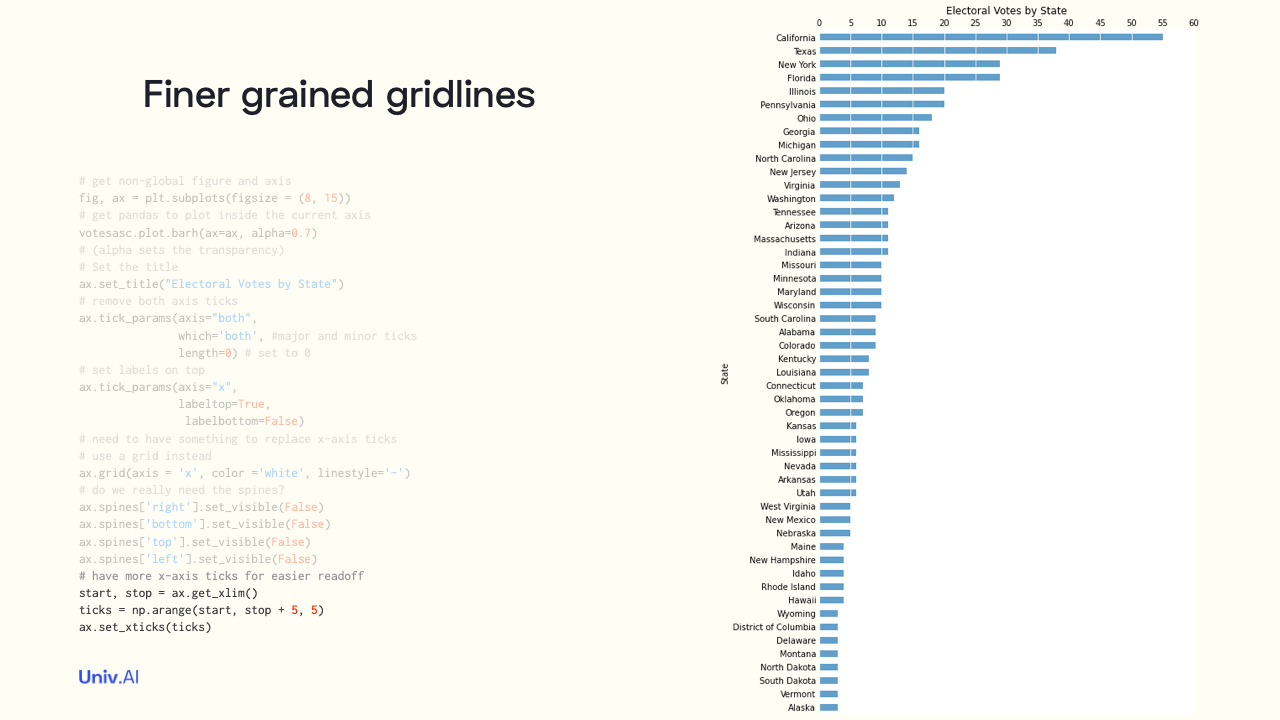
- If you want to show more precise distinctions between the states' electoral votes, you want the grid to be more fine grained. So lets have a tick every 5 votes, which translates in our grid visual to a grid line every 5 votes.
- The grid line labels look entirely redundant. After all, we can count off the grid-lines. So lets get rid of them, and eliminate the clutter. And then, why not show the user the electoral votes for each state at the end of its bar? Dont make the user think!
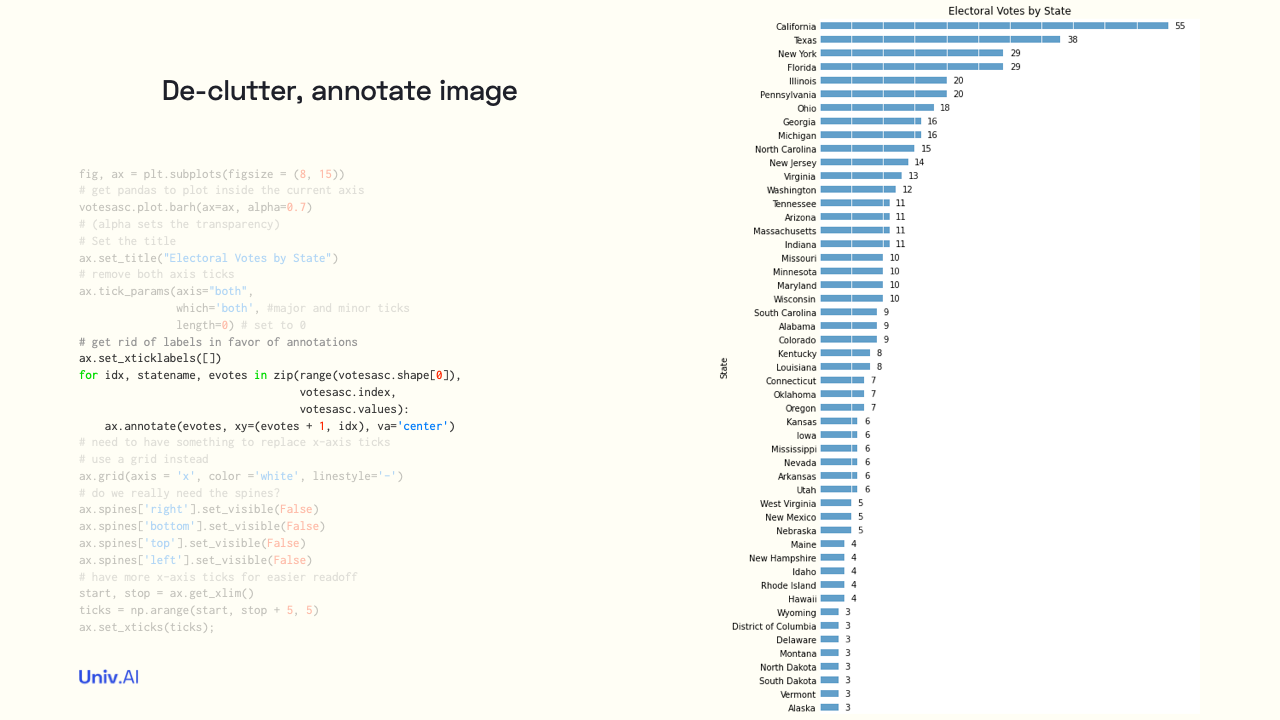
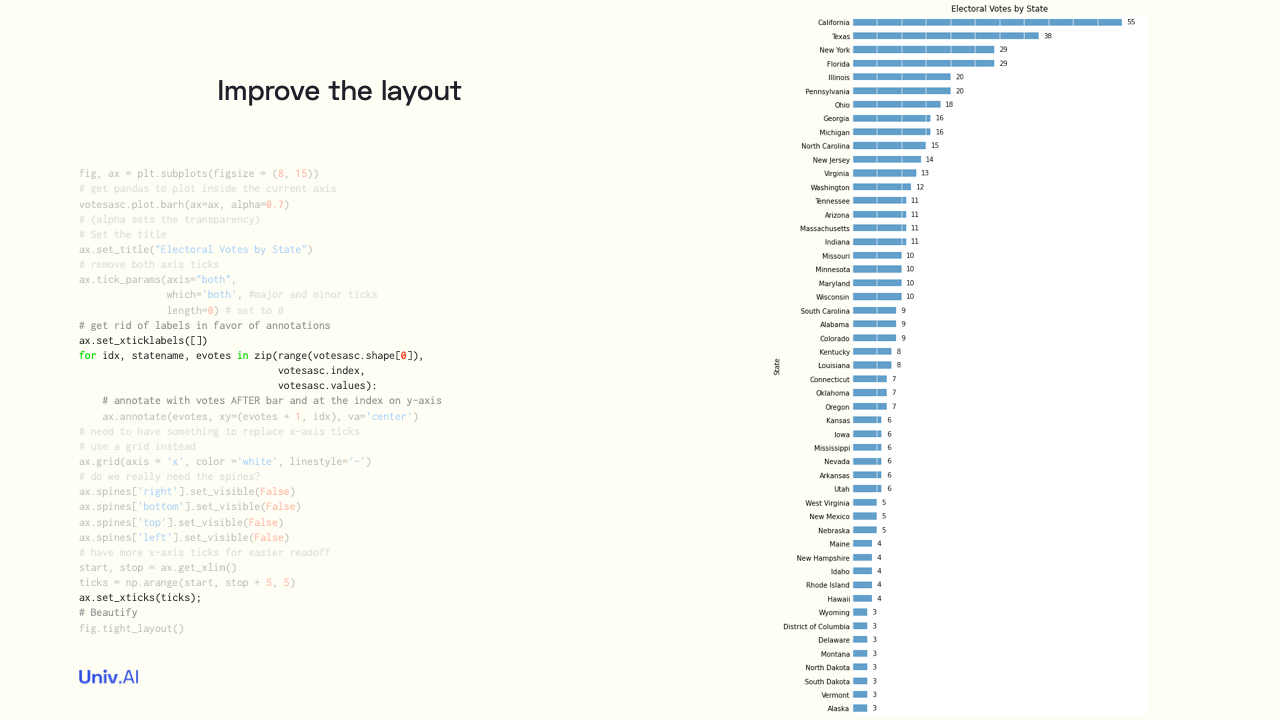
- The annotation is done by putting down text at an x of 1 greater than the electoral votes and a y obtained as a index (increasing from top to bottom) from the way matplotlib handles bar plots. We then let matplotlib clean up the layouting of the plot to make it look crisper.
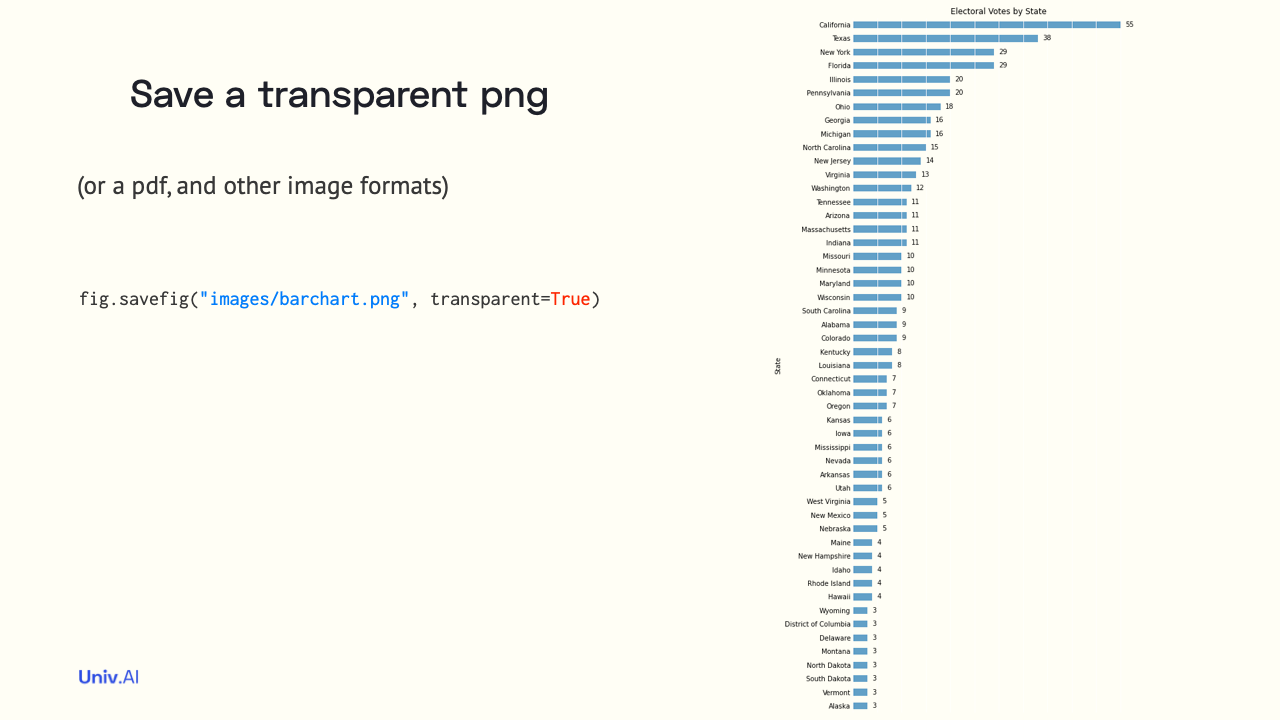
- Maybe you want to see this image in your slides or website based on the color scheme of your slides or site respectively, rather than having a white background. Then you can
savefigthe figure as a transparent png. There are multiple other save options as well.
-
An incredible source to learn the ins and outs of @matplotlib is https://end-to-end-machine-learning.teachable.com/p/navigating-matplotlib-tutorial-how-to/ by @brohrer . I teach this stuff as well, as part of the Data Science courses at <Univ.Ai>.
-
This story is permalinked at https://stories.univ.ai/improvingfigures/. I'll soon be tweeting on re-producing the @FT vaccination plot mentioned earlier. So do follow me on twitter at @rahuldave and keep an eye on https://stories.univ.ai for more!